Back to blog
Customer
How Bjarke Ingels Group built best-in-class reporting without a data team
Written by Thomas Wilhelmsen, CEO
Written by Thomas Wilhelmsen, CEO
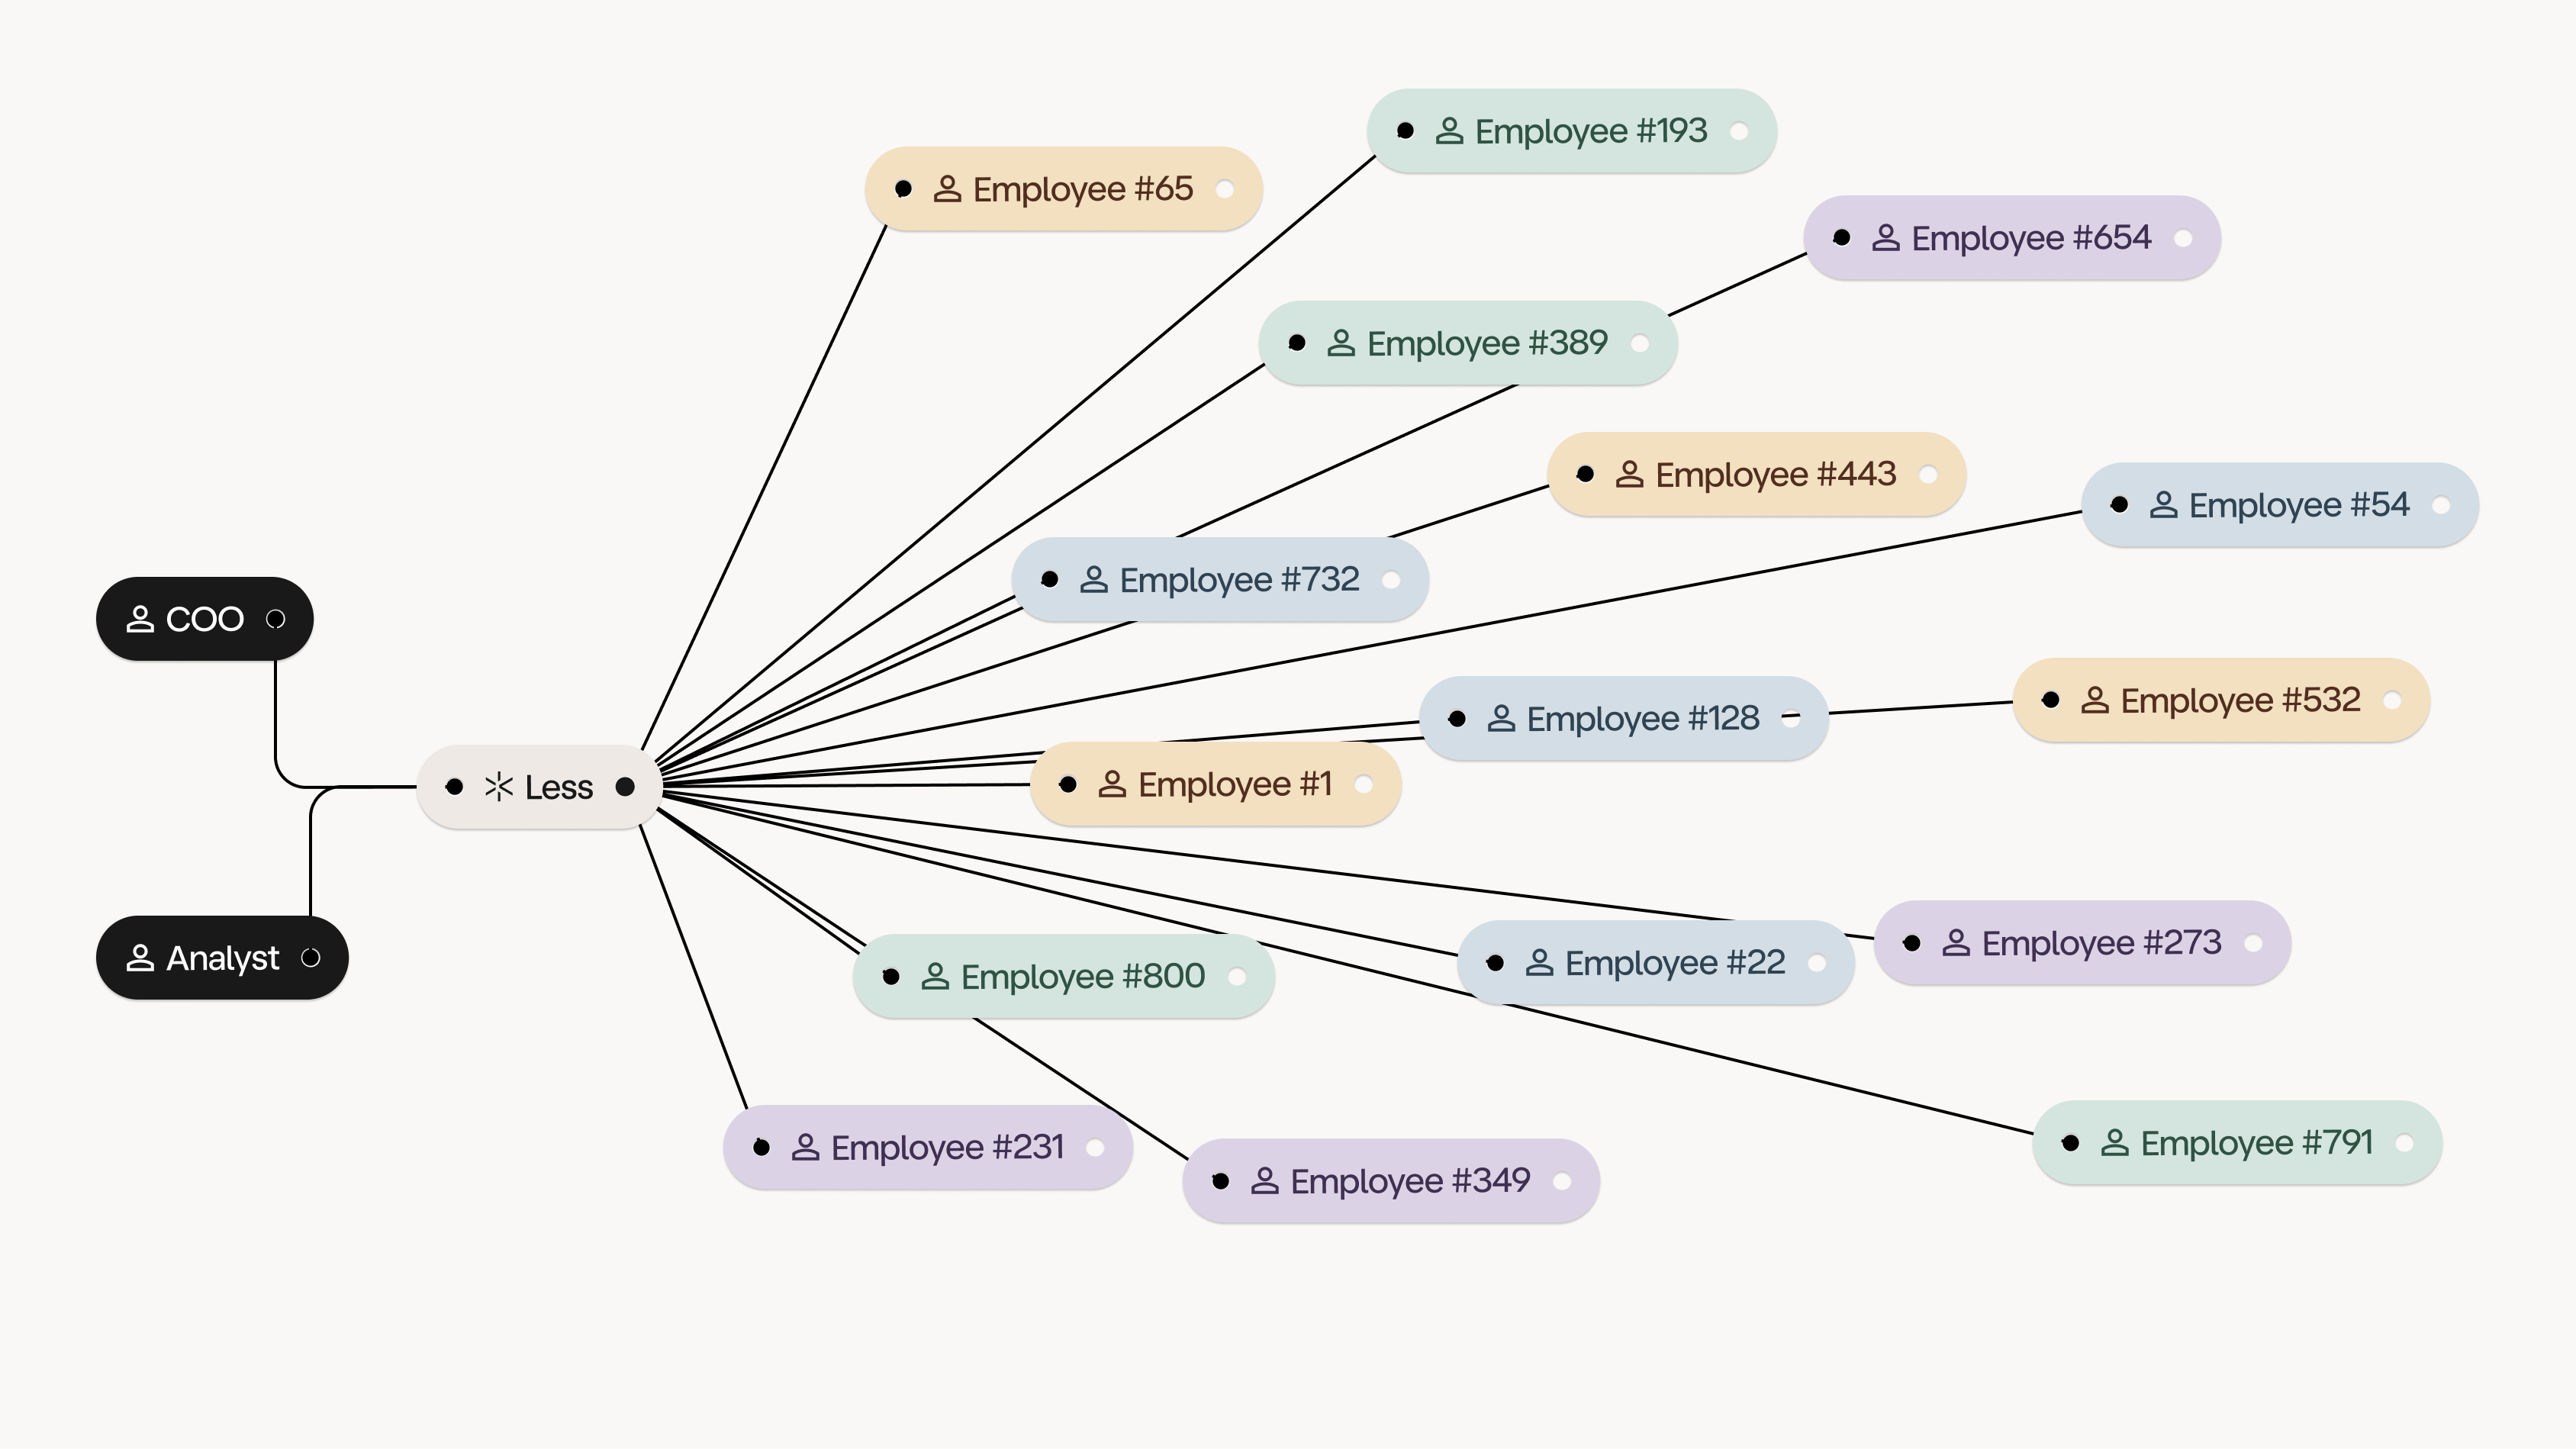
An 800-person architecture firm with nine offices and no BI department. With Less, the Chief Operating Officer and an analyst run the entire operational reporting on Less. Mads Bjarrum, BIG's COO, puts it plainly:
“Less has been a key enabler in helping us build best-in-class reporting, particularly for our industry. If a platform like Less didn't exist, it would have been difficult to convince the company to invest in data analytics and reporting” - Mads Bjarrum, Chief Operating Officer
Operational reporting at this scale usually requires a dedicated BI team or a long consulting engagement. BIG runs the whole thing with two people: Mads and Tobias (Strategy and Insights Analyst). No engineers. No data scientists. Two operators who own the firm's data pipeline end to end while completing a wide range of other tasks.
This post walks through how they do it: the three reporting workflows that have the highest impact at BIG, the tools they evaluated and rejected along the way, and what the setup means for any architecture firm whose reporting still lives in monthly Excel spreadsheets or costly setups.
Architecture firms sit in an awkward middle ground operationally. They run highly complex international project-based businesses - phased revenue recognition, multi-office staffing, compliance requirements, constantly shifting project exposure - but most still rely on spreadsheet-heavy monthly reporting processes underneath it all.
The issue usually isn't lack of data. Most firms already have the data somewhere across finance systems, HR systems, project management platforms, and spreadsheets. The issue is that traditional BI approaches assume a technical organization exists internally to build and maintain reporting infrastructure over time. And most architecture firms aren't structured that way. As a result, operational reporting ends up depending on the same mix almost everywhere, BIG included:
spreadsheets per office
that one finance person who understands the formulas
a consultancy that built a cube three years ago
one Power BI model nobody dares to touch
Before signing with Less, BIG had been scoping a reporting project with a couple of consultancies. Mads remembers the maths:
“We'd have to buy a lot of consulting hours, and we'd end up with a static solution. And if we suddenly needed something different, we'd have to buy more and more consulting hours. We had no realistic way to do this ourselves - we’re not set up with an in-house development team.” - Mads Bjarrum, Chief Operating Officer
There are two core issues with that approach: 1) the initial cost of the build and 2) more importantly, that the dashboards and output freeze the moment the consultants leave. Every new question after handover means re-engaging the consultancy. The choice BIG was being asked to make was between a deliverable that ages quickly and a permanent retainer.
What mattered most to Mads wasn't a feature list, but that a business operator could own the tool: "It was a code-less platform, which I could understand just by looking at it. If you could create pivot tables in Excel, you could suddenly make Power BI reports using Less".
The first dashboard - a partner project overview - was 80% complete within days of signing. Mads's own first hands-on session took twenty minutes: pulled in a data source, dropped four columns, renamed the rest, filtered, combined with another system, done. Many BI initiatives become six-month projects where IT, finance, and an external consultancy debate the data model. BIG skipped that phase entirely.
Less sits between BIG's source systems across project management, finance, HR, a few smaller feeds and Power BI dashboards. Tobias owns the pipeline end-to-end.
A handful of processes are already running through Less. Two of the most important carry most of the operational reporting weight – a regional risk management analysis and partner-level revenue overviews - with a third, monthly revenue recognition, lined up as the next build.
Every architecture firm with international projects fields the same call from their CEO or managing director after every major news cycle: what's our exposure? In 2026 it's been asked about tariffs, the Middle East, the US executive orders, and currency moves - multiple times each.
At BIG, "exposure" doesn't have one definition. As Tobias puts it:
“You can be exposed in different ways. It might be that we still have outstanding payments. It might be that we haven't invoiced a client yet. There are various dimensions to exposure.” - Tobias Teining, Strategy and Insights Analyst
Before Less, answering it meant pulling invoiced amounts from the finance system, work-in- progress from the project system, then mapping them together in a spreadsheet - a manual step repeated office by office. Now Tobias runs it from a single workflow. Beyond the time saved, the workflow surfaces detail the old spreadsheet process buried:
"When the question comes in, the workflow is already built. Our MD doesn't just see what she asked about - we can help spot that 'hey, over here in the New York office we have some risk in this area, and over here in the Barcelona office we have some risk too.' A question that used to take a full week to answer now takes half a day - and surfaces adjacent risks across other offices in the same view." - Tobias Teining, Strategy and Insights Analyst
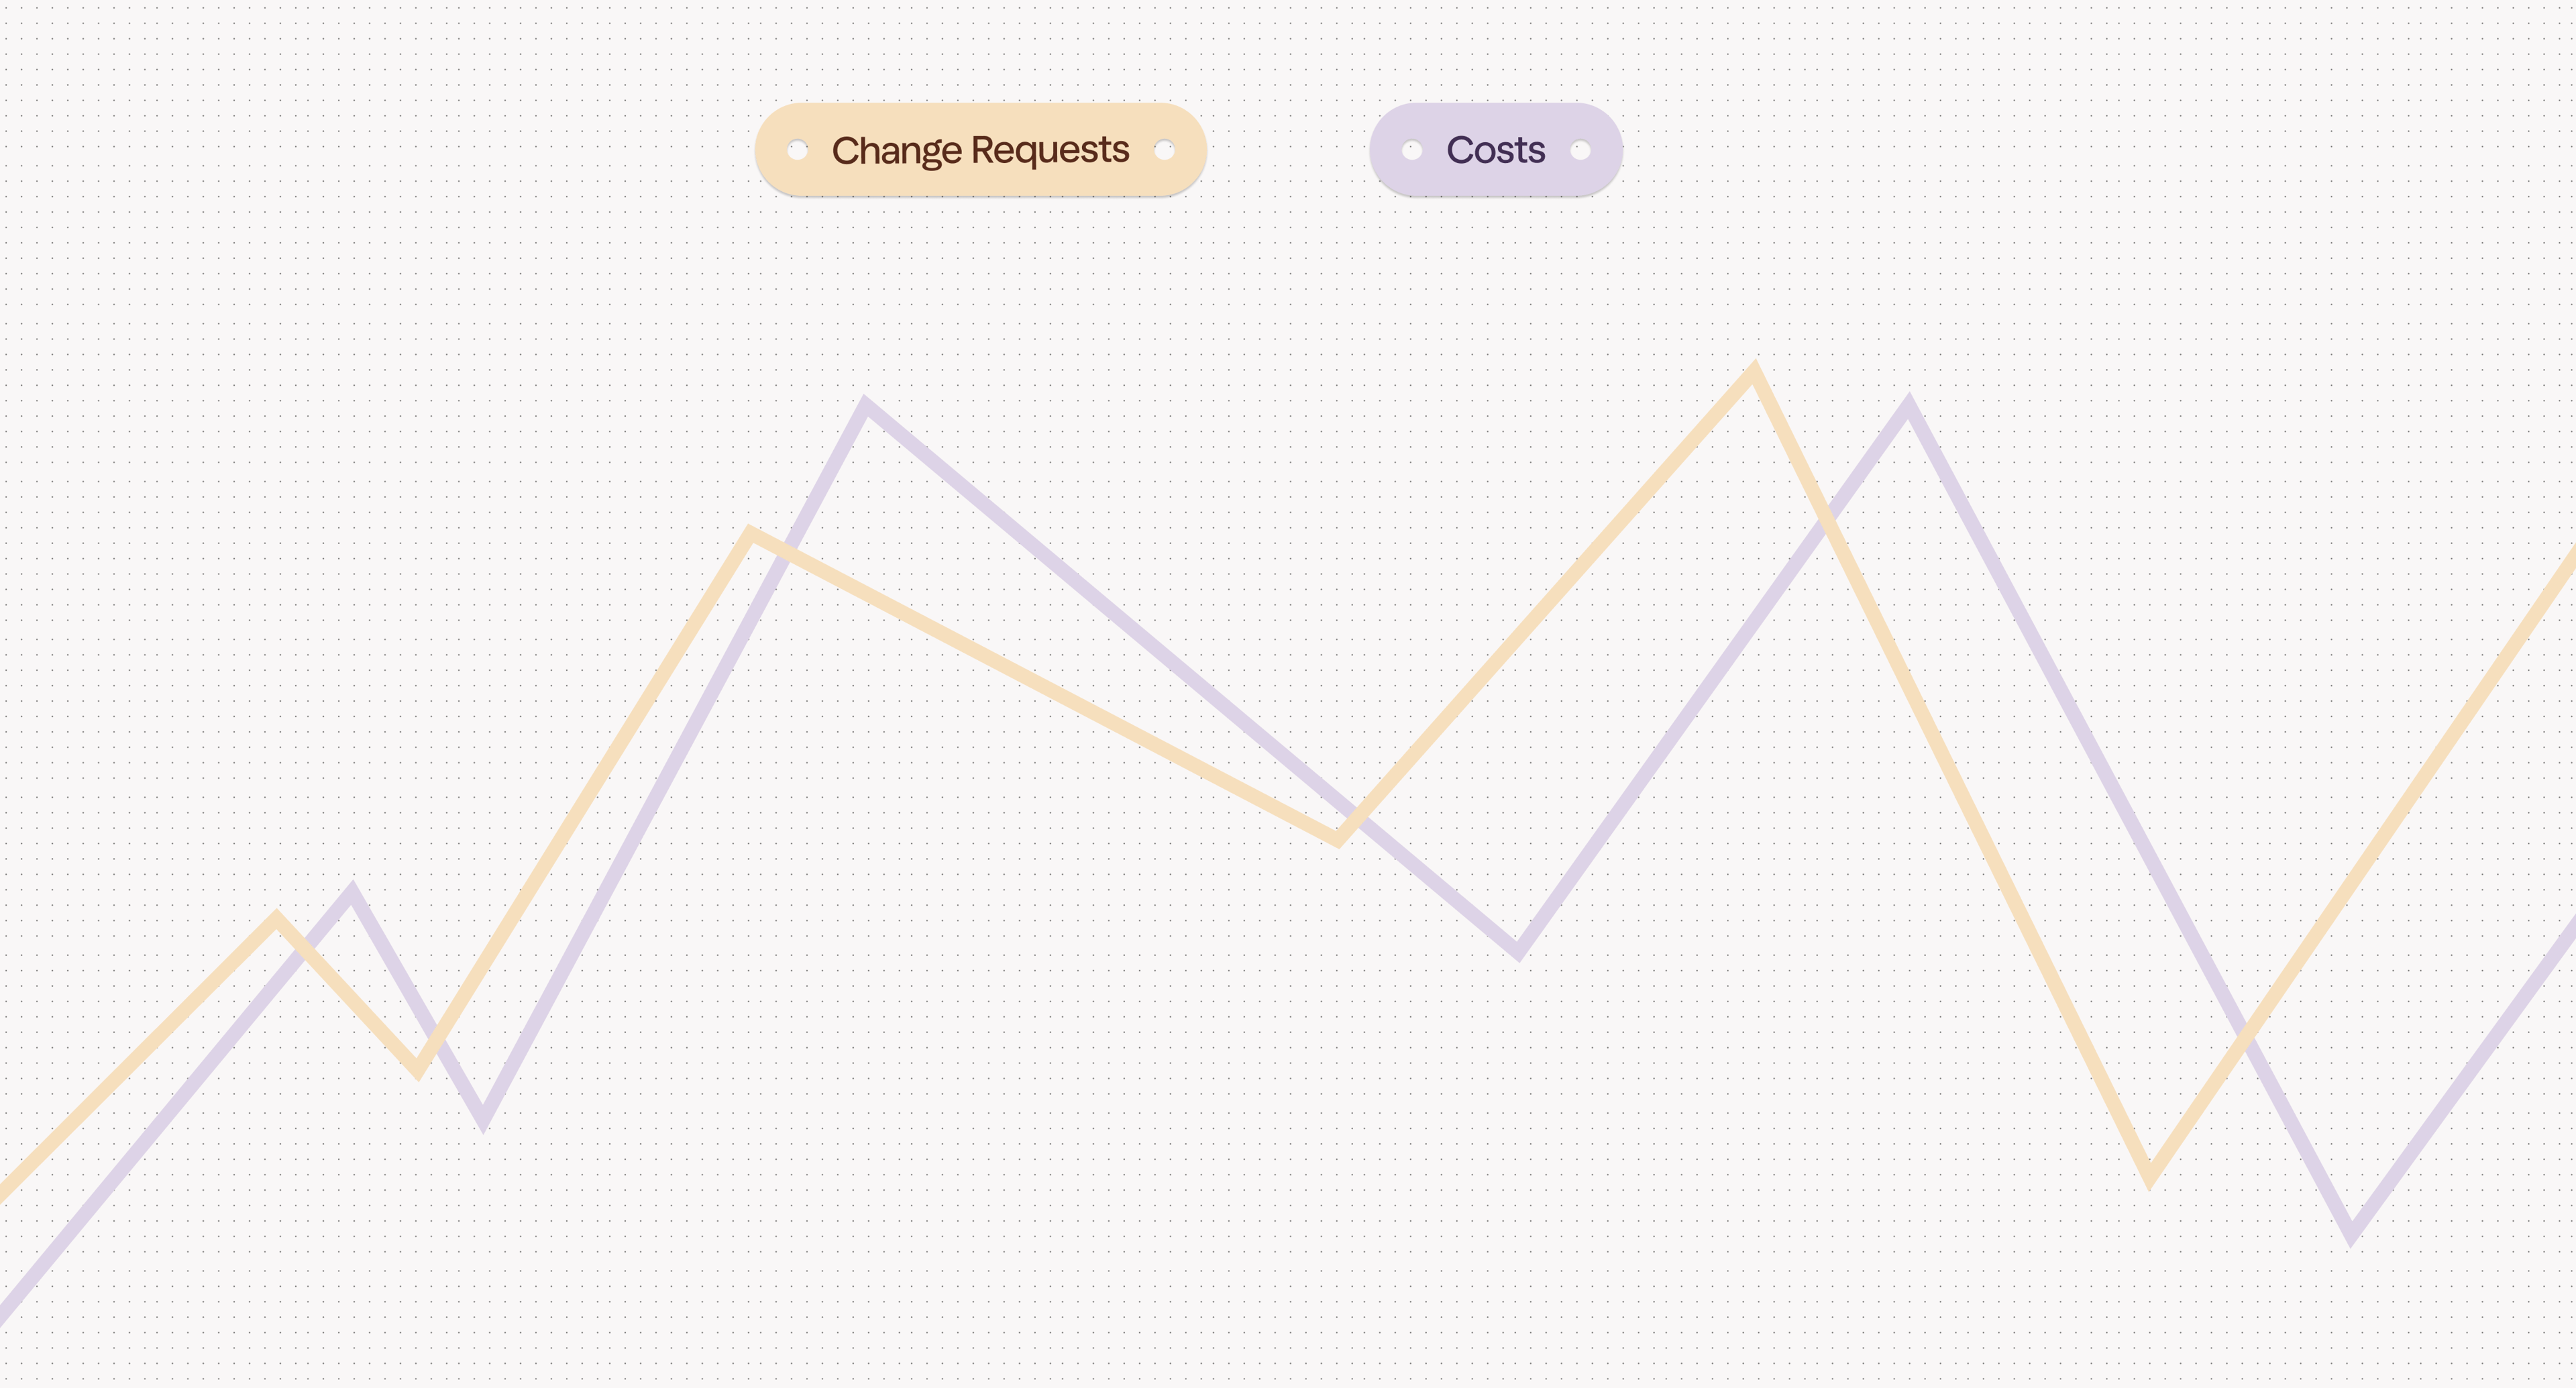
BIG's partners want to see their revenue and costs every month. Before Less, generating either meant chasing many files across multiple systems and stitching them together. Now it's a quick scan from Power BI with Less handling the data underneath:
“Just pulling a project revenue overview that used to mean fetching multiple files and mapping them together - and now they can just click download in a Power BI.” - Tobias Teining, Strategy and Insights Analyst
It's a monthly fixture at every architecture firm, and Tobias is blunt about how the process typically works:
“The way architecture firms recognise revenue is: how far are we on this project, and how much have we been paid? That's the essence. And all those companies out there are, almost without exception, using an Excel spreadsheet every month to calculate it.” - Tobias Teining, Strategy and Insights Analyst
At BIG today it means extracting data from their project management system and their accounting system before mapping it together by hand. Across offices, the process requires recurring manual effort each month to bring data together from multiple systems. Over time, that represents a meaningful operational load for something the business depends on regularly.
It’s the next workflow BIG is moving into Less. The goal is to retire the monthly spreadsheet entirely: pull the inputs once, build the logic in Less, and have it run on a schedule, so revenue recognition changes from a manual task to an automated process. Given how closely it mirrors the three workflows already live, it's a natural next step.
Couldn't a firm just do all of this with the tools they already have? BIG evaluated each of them. Tobias has used Alteryx in a previous role and Power BI extensively at BIG. Mads has been pitched data cubes by Business Central consultants more times than he can count.
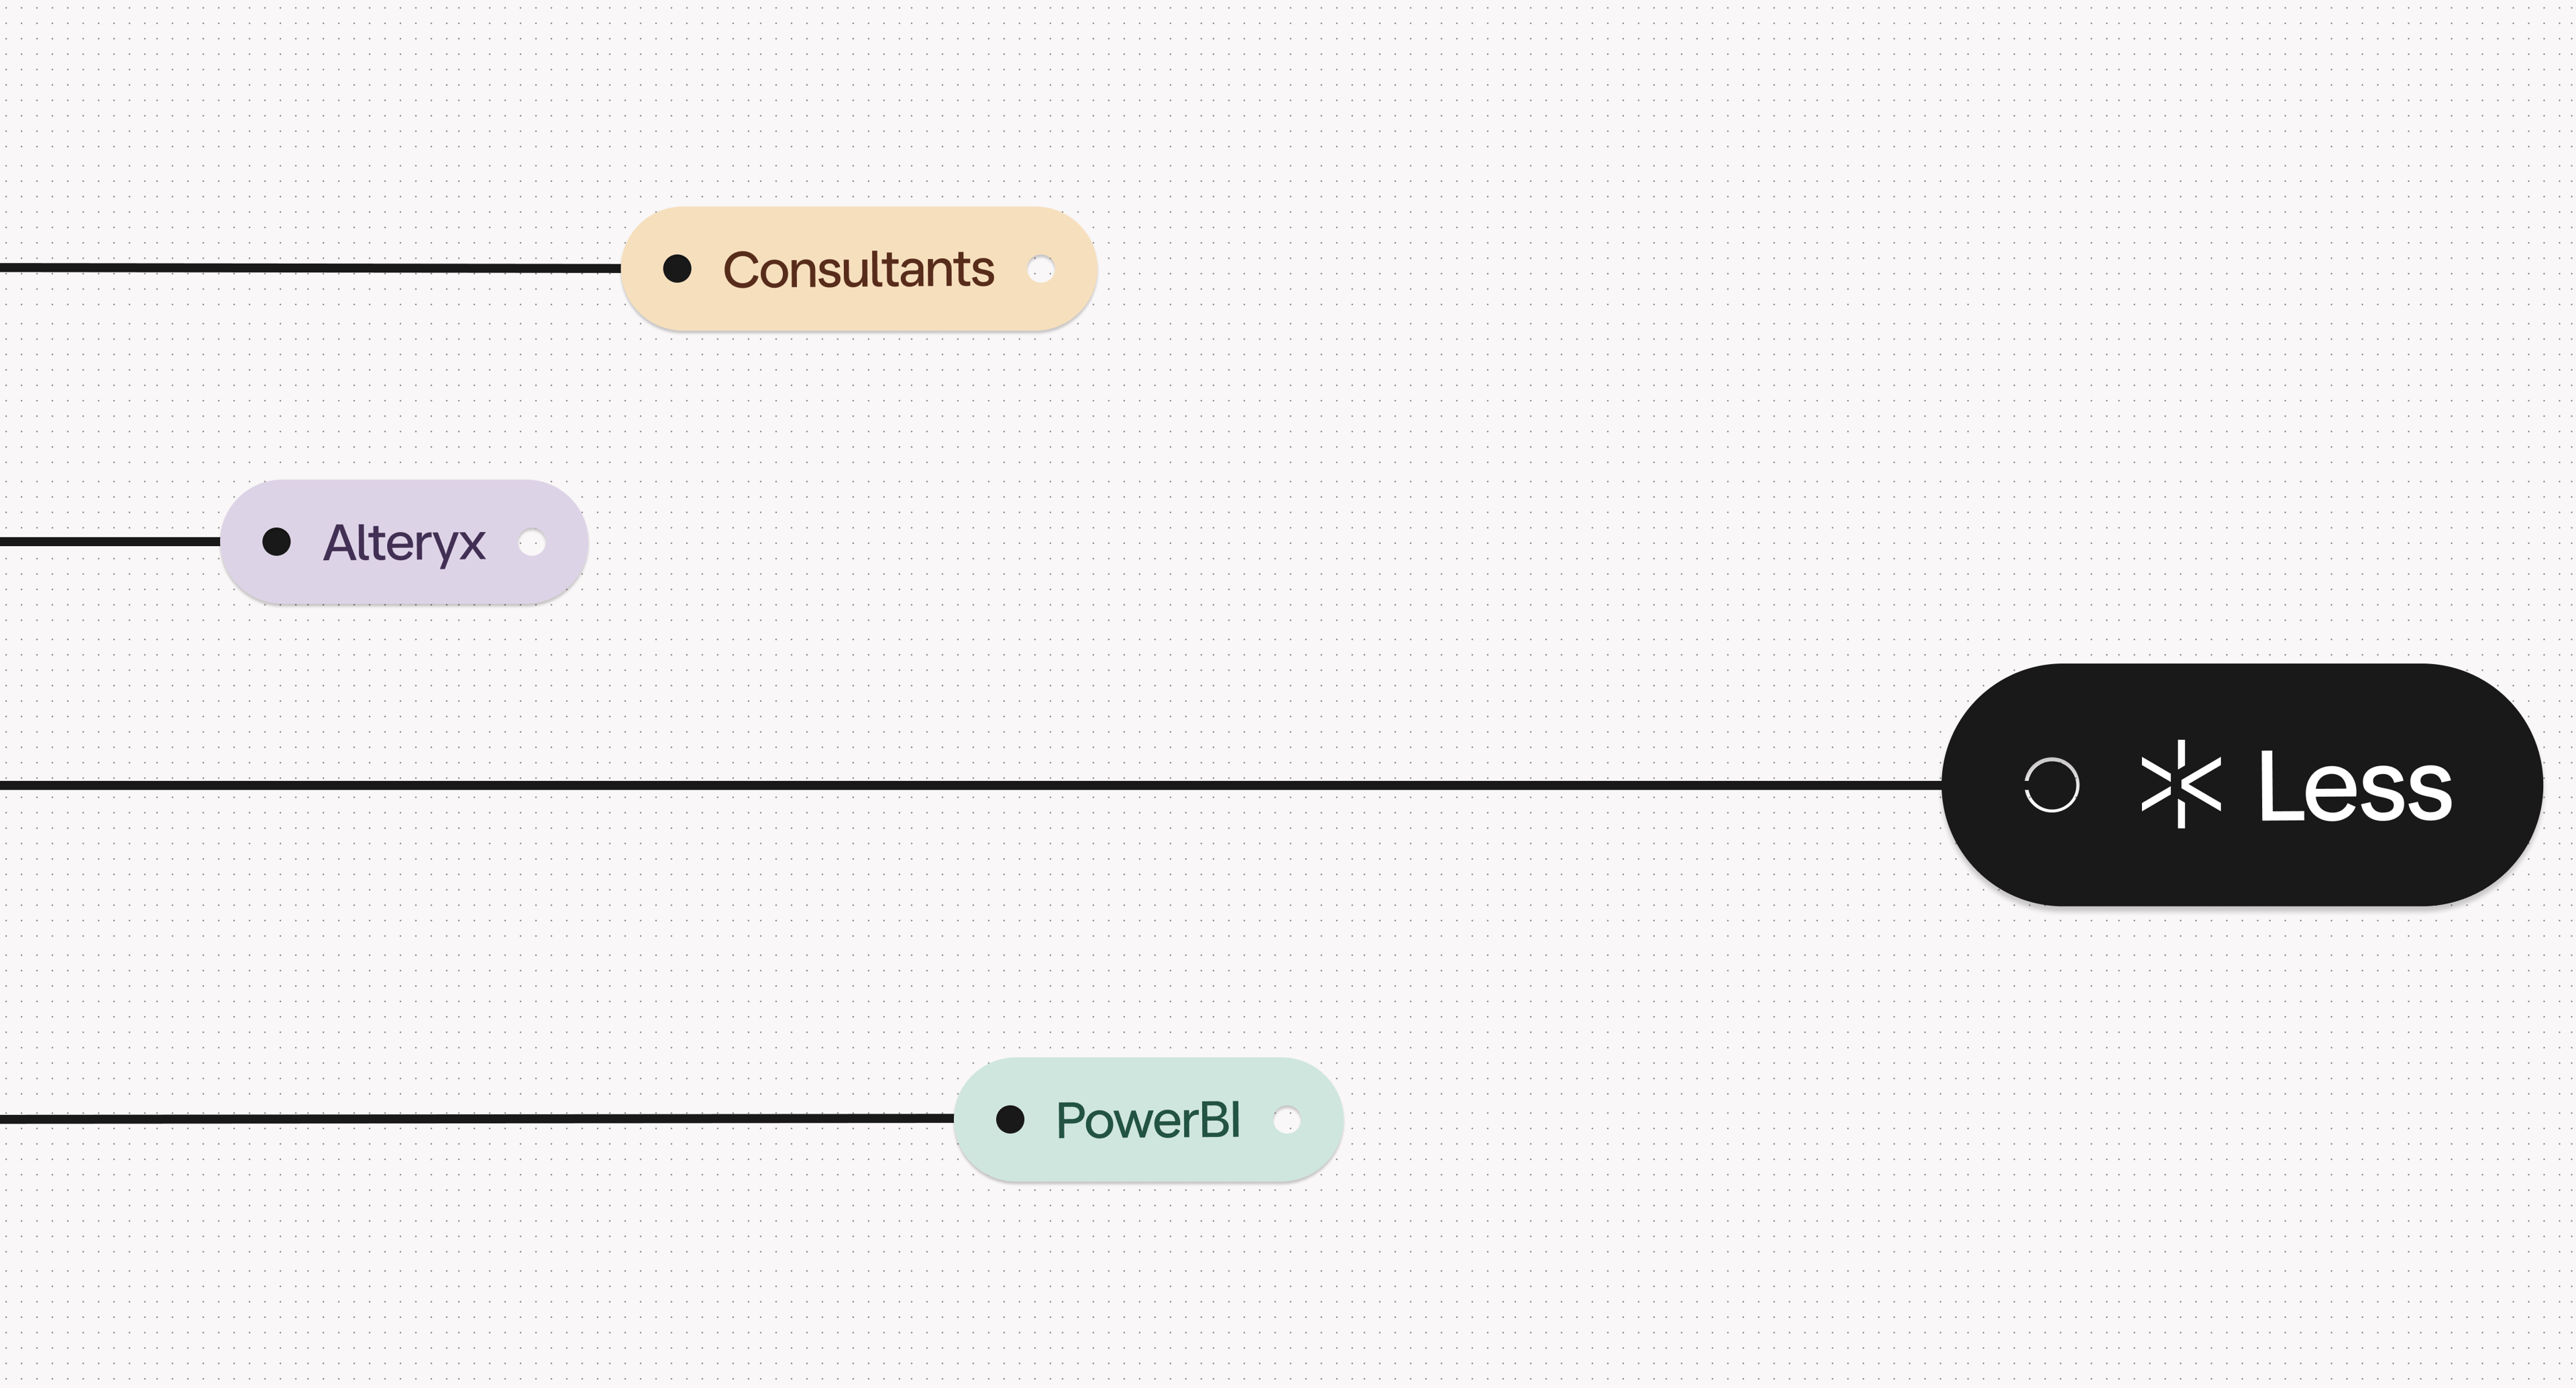
The primary concern wasn't that those tools were incapable but more so about ownership. Traditional BI tooling assumes a technical organization exists internally to build and maintain reporting infrastructure over time. Most architecture firms aren't structured that way.
On Alteryx. Mads is short about it: “If you ask anyone 'can I just download Alteryx and get started?' Everyone will say no. You'll need to get a certification. Or you need specialist support. Or that it’s very difficult to maintain internally.”
Tobias's share the experience: “I found it a bit heavy. Things took a really long time to run”.
On data cubes. Mads again: “It's so much cheaper than buying a data cube from some consultant, which is rigid and inflexible. I'd have to pay extra if I want my HR data in there. Pay extra for all this additional data.” Each new question meant another invoice. For a firm that wants to ask new questions monthly, that model doesn't work.
On Power BI alone. This is the one most architecture firms’ default to, because they already have it. Tobias's verdict on using it as a data transformation tool:
“Have you ever tried transforming data in Power BI? It's completely mindless. When you try to troubleshoot a problem inside something that's been built down in Power BI, you have to click back through each model and try to figure out where something is actually being done. The visual logic that Less covers - Power BI just doesn't cover that. They've built it as if it's for IT people.”
And he closes with: “I almost wish you could take a screenshot of what thirty steps in Less looks like versus thirty steps for the same output in Power BI - that would be your best answer”.
Less and Power BI aren't competitors at BIG. They run side by side. Less handles the data wrangling; Power BI handles the visualisation layer. The transformation work - the joins, conditional logic and validation - happens in Less because trying to do it in Power BI's Advanced Editor doesn't scale past a single person who happens to enjoy writing code. It also means Power BI can do what it does well: visualisations.
The pattern across all four workflows is the same. BIG didn't build a reporting advantage by becoming a software company internally. It built one by making operational reporting maintainable by the operations team itself.
Mads describes it as a shift in what the operations team spends its time discussing:
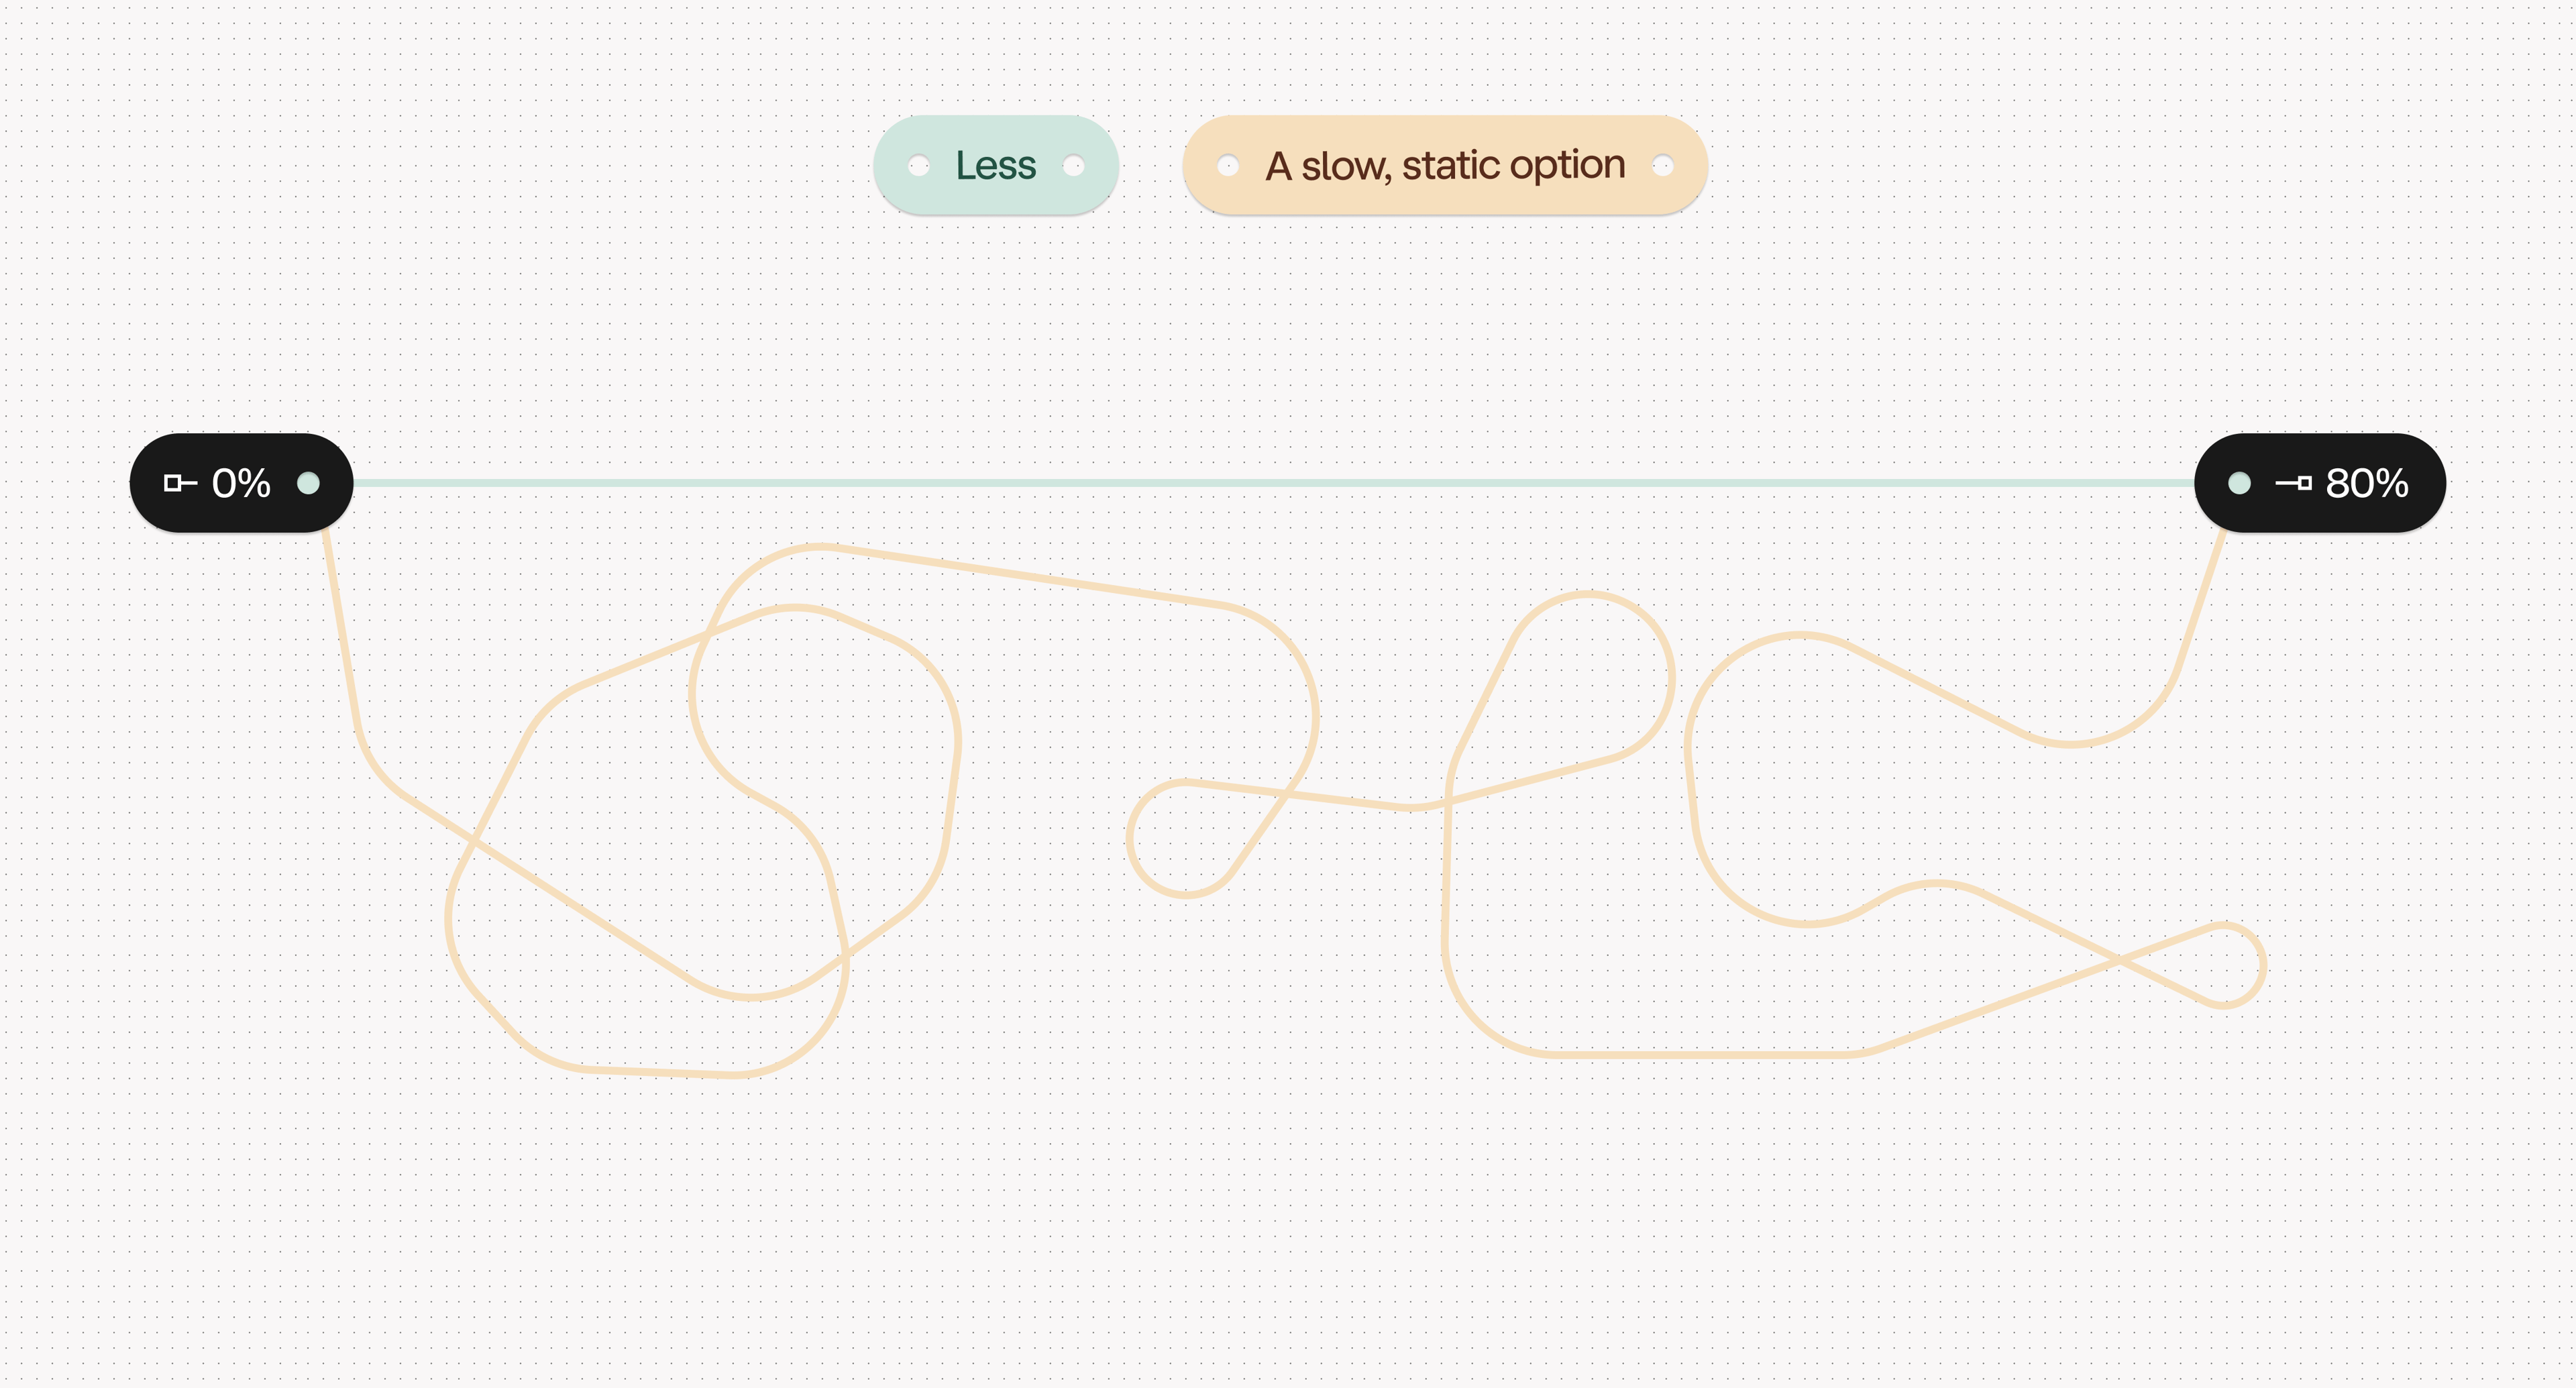
“With Less, we get through the first 80% of the work lightning fast. So instead of talking about data, you talk about the output. We always talk about value. We never talk about data. We can now start with the result, because we can say 'okay, what do we want to be able to see?' And then we can work backwards very quickly, because we have the data where it needs to be. Whereas in other companies, the first thing you'd have to start with is 'how on earth do we get our data under control?’” - Mads Bjarrum, Chief Operating Officer
That shift is why a two-person operation can produce reporting that Mads refers to as best-in- class for the industry. The team doesn't spend its time on data infrastructure. It spends its time on using the insights generated by Less and PowerBI to inform decision-making.
Tobias frames the operational principle the same way:
“Priority number one is the value. How we build becomes priority number two.” - Tobias Teining, Strategy and Insights Analyst
It also means BIG runs on a single source of truth. As Tobias puts it:
“Reporting is facts and figures. But when everyone is doing their own report, things become a bit more open to interpretation. You can read things a bit more loosely, and I think that's completely insane in a large company.” - Tobias Teining, Strategy and Insights Analyst
Several offices, multiple spreadsheets, slightly different definitions of "revenue this month" is still how many architecture firms operate today.
Most firms know the setup is suboptimal. They've lived with it because the alternatives were an expensive BI team they couldn't justify or a consultancy engagement they couldn't maintain. Less is the third option: the firm owns its reporting without either.
Book a 20 minute demo, and we'll run your messiest task live on your actual data.
Set it up