Changelog

Changelog

The latest product updates, improvements, and fixes.

  • Updates to Draft and Publish

    The Canvas now tells you when you are looking at something other than what actually runs.

    Opening a model lands you on the latest version, but scheduled runs use the published one. When those two drift apart, it is easy to edit or debug the wrong thing. This release makes that difference visible, and gives you a safe way back.

    • A version badge in the Canvas header. The badge next to the model name now says exactly what you are looking at - Published, Version, Draft, or Autosave — and opens a menu with when it was last saved. From there you can save and publish, open the published version in a new tab, or revert.

    • A warning when you are not on the published version. A banner across the top of the Canvas tells you that scheduled runs use the published version, and whether what you are looking at is newer than it or simply unpublished. It links straight to the published version, and you can dismiss it for the session. It stays out of the way once you save something yourself during the session, since that is a deliberate edit.

    • Revert without losing work. Reverting to the published version first saves whatever is on the Canvas as a named version, then opens the published one in place. Nothing disappears because you went back.

    • Open the published version from the folder. When a model's published version is not its latest, the asset menu includes Open published version, so you can jump to what actually runs without opening the Canvas first.
  • Introducing the Less Python SDK

    Write custom Python scripts locally, then run them on Less with scheduling, logs, and compute included.

    Sometimes a step in your pipeline needs more than the Canvas offers - a custom API integration, a bit of statistics, or a library only Python has. The new Python SDK lets you write that step yourself without leaving Less behind.

    Install it with pip install less-sdk, and the same import less script runs on your machine and on the platform. Develop and test locally against your real tables, then paste the script into a Python asset in Less to get scheduling, job status, logs, notifications, and flexible compute - no infrastructure to set up.

    Here's what it can do:

    • Read and write tables. less.list_tables() and less.read_table() load any table you have access to as a pandas DataFrame - including tables created by sources, models, and other scripts. less.write_table() stores a DataFrame back as a table, either replacing it or appending new rows, ready for use downstream on the Canvas or in a destination.

    • Log back to Less. less.log, less.info, less.warning, and less.error show up in the job's logs and status, so a failing script is as visible as any other asset.

    • Keep secrets out of your code. Store API keys and other config on the asset's Variables step - values are encrypted - and read them with less.get_variable(). Execute requests can override them per run with less.get_parameter().

    • Get started in one click. After saving a Python asset, the new Local SDK setup modal generates a ready-to-run script with your credentials, so you can be developing locally in minutes.

    Full documentation is available at docs.less.tech/python-sdk

    See example code from hero image at https://ray.so/9UC9Ktv

  • Summer Improvements

    Many quality-of-life improvements

    This release brings a bunch of smaller improvements, amongst other:

    1. Fix copy into Parameters tool. The Parameter tool input were blocking copy/pasting. That is fixed now making it easier to copy/paste variables like API tokens.

    2. Fix large node hover on objects. We fixed an edge case bug where hovering very large Object data type cell values to view their content could crash the browser.

    3. Expanding last column in datagrid is now enable to make it easier to view full content of cells.

    4. Parse Object. The Parse Object had an unforeseen problem where parsing could override existing columns sharing the same name. That now creates a warning and we have now added two new configuration options: 1) to add a prefix or 2) to replace existing columns.

    5. Log filterering. We fixed an issue where adding a log filter on any log page not being the first one would show nothing instead of resetting pagination. That is now fixed.

    6. Lineage Levels. Sometimes dependency graphs get very complex when tables are used in 10 layers and processes. You can now filter to 1) All, 2) two layers or 3) one layer to get a neater overview of immediate dependencies. The layers work in both directions of the target object - so if you’re looking at upstream and downstream dependencies and choose to view 2 levels, you would get 4 layers (2 upstream + 2 downstream)

    7. We fixed a minor bug in our Google Sheet Source where it was impossible to fetch new metadata for sheets that had already been configured. That blocked selected new columns that had been added to the Google Sheet since creating the Source in Less.

    8. CMD+B was opening both the Less Assistant and setting the font as bold when editing a Comment tool on the Canvas. We fixed that.

    9. Using arrows while renaming the title of a model on the Canvas closed the popover. That has been fixed.

    10. Lineage zoom didn’t work on Windows. We’ve now added dedicated buttons and fixed the keyboard shortcuts.

  • New GeoSpatial options

    Two new GeoSpatial tools and improvements for geocoding.

    Today we’re releasing two new tools for working with geometry on the Canvas and updates to our Geocoding capabilities

    The new Center tool takes a polygon column and returns its center point as center_longitude and center_latitude. Useful when you need a single point per area - for maps, joins, or distance calculations - without leaving Less.

    The new Geo Transform tool is the broader geometry toolkit. It works on geometry columns in two modes:

    1. Convert format - move between TopoJSON, GeoJSON, and WKT. This is helpful to use with destinations. For example transforming to WKT before sending to Snowflake. And while on the topic we default to TopoJSON because it performs best at scale.

    2. Adjust geometry - reshape geometries in place:

      • Buffer (meters) expands a shape by a radius: points become circles, lines become corridors, polygons grow outward.

      • Simplify (meters) drops vertices on lines and polygons while keeping the overall shape; higher tolerance removes more detail.

      • Bounding box replaces each geometry with its axis-aligned enclosing rectangle (points stay points).

    Lastly, we added optional parameters to the city and region parameters to the Geocode tool to ensure a more accurate results.

  • Introducing the Less Assistant

    A new way to interact with Less.

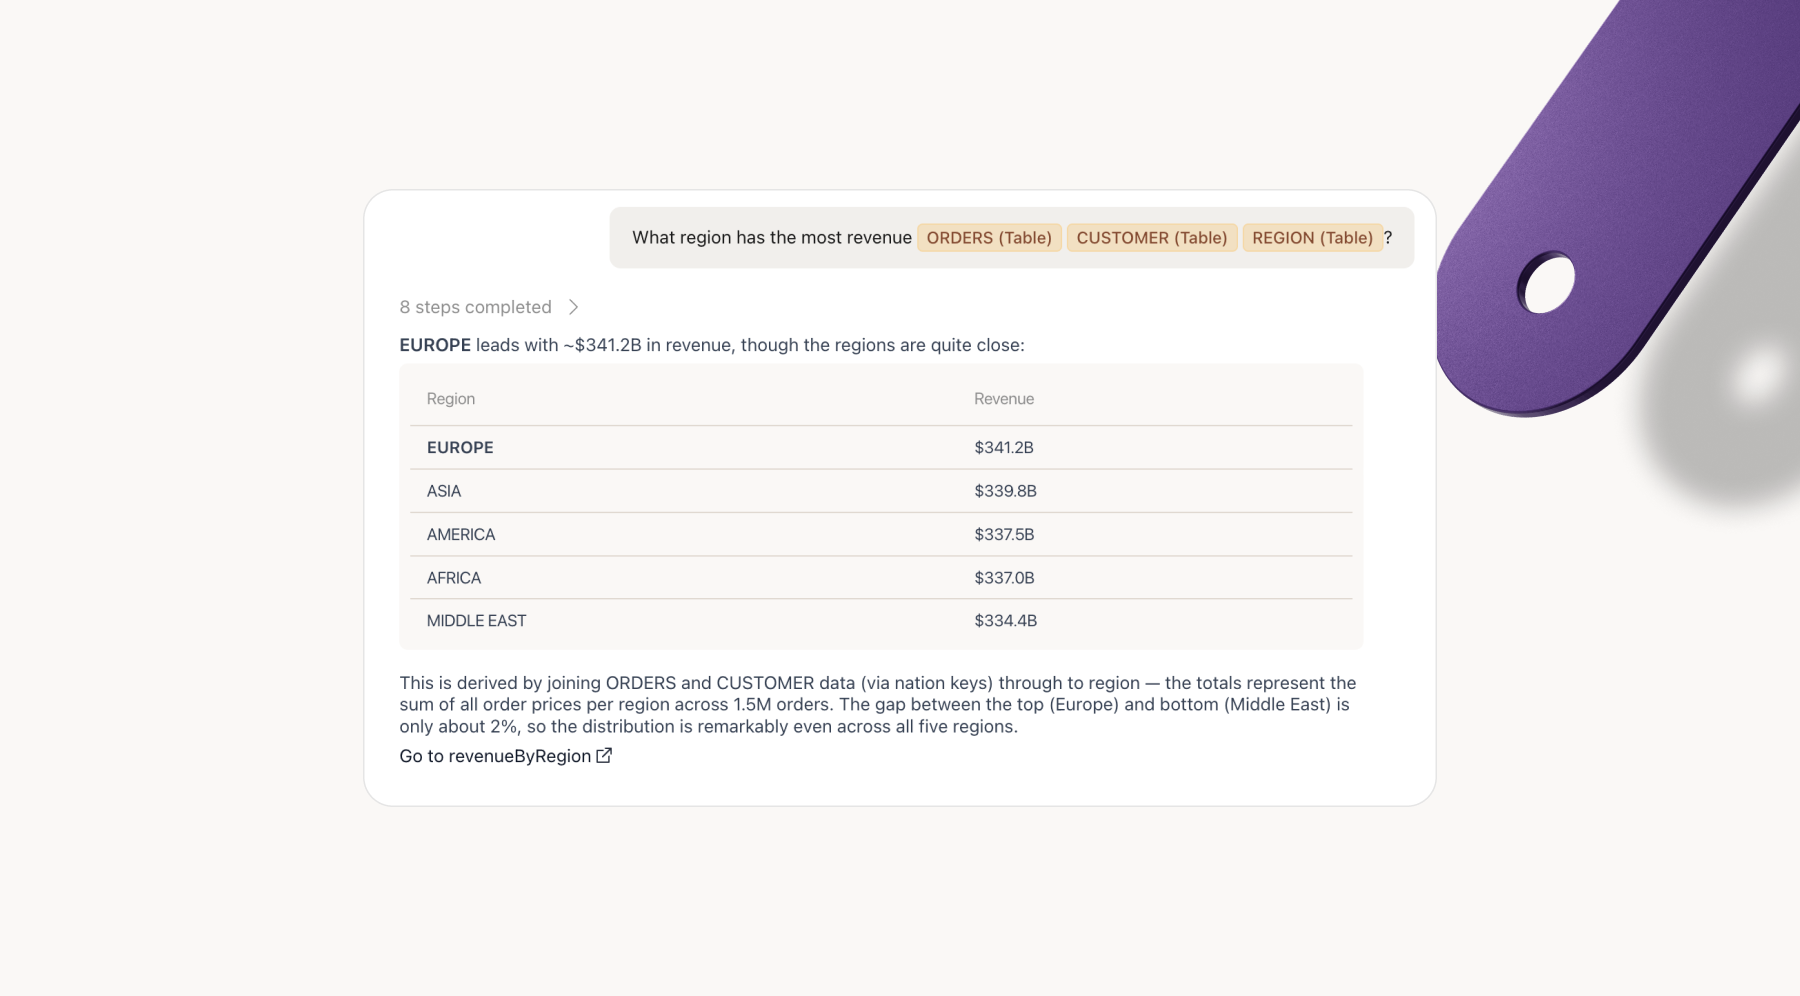
    You can now ask our new Assistant about your workspace and have it do the work for you. It explores your catalog, traces lineage, reads job logs, and answers questions about your data - and when you ask it to, it makes changes: running assets, editing configuration, creating sources and destinations, and managing access.

    The assistant does the legwork; you stay in control. Anything that changes your workspace happens at your request, and credentials are handled separately from the model (more on that below).

    Here's what it can do:

    • Understand your workspace and models. Ask it to find any source, destination, model, table, or orchestration, and it explains how they fit together. It reads metadata and configuration, traces lineage upstream and downstream ("where does this data come from?"), reads change history ("when did this break?"), walks a model step by step in plain English, diffs two model versions, and runs semantic search across pipelines ("which models filter on column X?").

    • Monitor jobs and debug failures. Get run counts by status over any date range, open individual runs with deep links to their logs, and read the logs themselves - error-level by default, or in full for "which step was slowest?"

    • Analyze your data. Ask questions of your verified tables and get a direct answer back, along with a plain-English explanation of how the assistant arrived at it.

    • Act on assets. Run an asset on demand, set or clear schedules (cron, with timezones handled), edit basics like name, description, table prefix, and compute size, patch connector configuration (including reordering orchestration pipelines), create and move folders, duplicate assets (folders included), and publish a model version.

    • Create sources and destinations. The assistant walks you through a new connection end to end - browsing connector types, checking requirements, collecting credentials or OAuth, testing database connections, and selecting Google Sheets or SharePoint files. Secrets are collected in a dedicated form and never pass through the model.

    • Manage access. Find users, list and create groups, add members, inspect roles and folder permissions, and set a group's role on a folder.

    Why it's accurate. Everything is backed by a transaction log with real data, not just metadata. And because Less is no-code, every transformation is structured and explicit, so the assistant can reason about what each step does without guessing.

    What's next. The assistant doesn't build or edit models on the Canvas yet. That's what we're working on now.

  • A new way to Explore

    Introducing our new Explore page - browse your assets, track activity, visualize lineage, and chat with your pipelines.

    The new Explore page gives you a single place to understand everything happening in Less.

    Browse

    You can view all your tables, sources, and models in one place. Each asset includes activity tracking - reads and writes for tables, version history for models - so you always know what’s happening and when.

    Lineage

    The headline feature is lineage. You can visualize entire data pipelines end-to-end and trace dependencies between assets. If something breaks or changes upstream, you can see exactly what’s affected downstream.

    Chat with your pipelines

    You can ask questions about your pipelines directly from the Explore page. Want to know how a column was created, whether there are scheduling conflicts, or why a dashboard might be showing stale data? Just ask. It covers anything related to pipeline health.

    This works as well as it does because of two things. First, everything is backed by a transaction log with actual data - not just metadata. That's one of the core benefits of an end-to-end platform. Second, because Less is a no-code tool, every transformation is structured and explicit. There's no ambiguity in what a step does. The operations are strict and well-defined, which means the AI can reason about them with high accuracy.

Do more with Less

Book a 20 minute demo, and we'll run your messiest task live on your actual data.

Set it up